
ecommerce conversion
customer experience strategy
digital customer experiences

Are you struggling to prove your marketing's real-world impact on revenue and profit? For too long, marketers have leaned on easy-to-grab but ultimately hollow numbers like impressions and social media likes.
These "vanity metrics" look great on a slide deck, but they crumble under the one question every executive asks: How did this actually impact our bottom line?
Truly effective measurement isn't just about reporting—it's about a fundamental shift in how we think. It’s about drawing a straight line from every dollar spent to core business goals like Return on Investment (ROI) and revenue growth. This is how marketing moves from being a line item on a budget sheet to a strategic driver of the entire company.
The goal isn't just to show that sales went up while a campaign was running. It's about proving your marketing efforts caused that spike.
Without that proof, marketing budgets are often the first thing to get slashed when times get tough. Why? Because the value feels fuzzy and unproven. A disciplined, data-backed approach is the only way to protect your resources and prove your worth.
The best in the business now blend multiple types of metrics to get the full picture:
Focusing on these commercial metrics is what separates the pros from the amateurs. It’s how you can walk into any budget meeting, prove your ROI with total confidence, and justify every penny you want to spend. For a deeper dive into these methods, the team at 9Rooftops has an excellent breakdown on how to measure campaigns effectively.
The Critical Shift: The most successful marketers no longer ask, "How many people saw our ad?" Instead, they ask, "How many incremental sales did our ad generate, and what was the impact on Customer Lifetime Value?" This change in perspective is what separates a cost center from a revenue driver.
When you adopt this holistic view, you stop just counting clicks and start measuring real financial outcomes. You transform the marketing department from a creative silo into a vital engine for growth, armed with the data to make smarter decisions and maximize every campaign's impact.
Effective measurement isn't something you bolt on at the end. It's the foundation you build before a single ad ever goes live. A solid measurement framework is your campaign's blueprint, making sure every move you make is deliberate and every dollar you spend is accounted for. This is how you stop guessing and start engineering real results.
Without a framework, you’re flying blind. Sure, you might see a spike in traffic, but you won't know if it's the right traffic. Is it profitable? Does it actually help the business grow? A structured approach ties your marketing directly to tangible business objectives, not just fleeting digital noise.
The first move is always setting clear, meaningful goals using the SMART framework—Specific, Measurable, Achievable, Relevant, and Time-bound. But here's the part people often miss: these goals have to flow directly from bigger business objectives. They need to answer the question, "How will this campaign help the company hit its quarterly or annual targets?"
This alignment is everything. It turns the marketing department from a cost center into a core part of the company's growth engine.
Just look at these two scenarios:
See the difference? Each goal is precise, measurable, and tied directly to a real business outcome—sales pipeline or profit margin.
Once your SMART goals are locked in, you need to pick the Key Performance Indicators (KPIs) that will track your progress. KPIs are the specific, hard numbers that tell you if you're on the right track. This is where you have to be ruthless and separate the valuable signals from the vanity metrics that just make you feel good.
For that B2B goal of boosting MQLs, you're not just counting webinar sign-ups. Your real KPIs would include:
And for the e-commerce goal of cutting down cart abandonment, you’d be watching:
This chart really drives the point home, showing how different metrics tell a connected story, from top-of-funnel impressions all the way down to the bottom line.
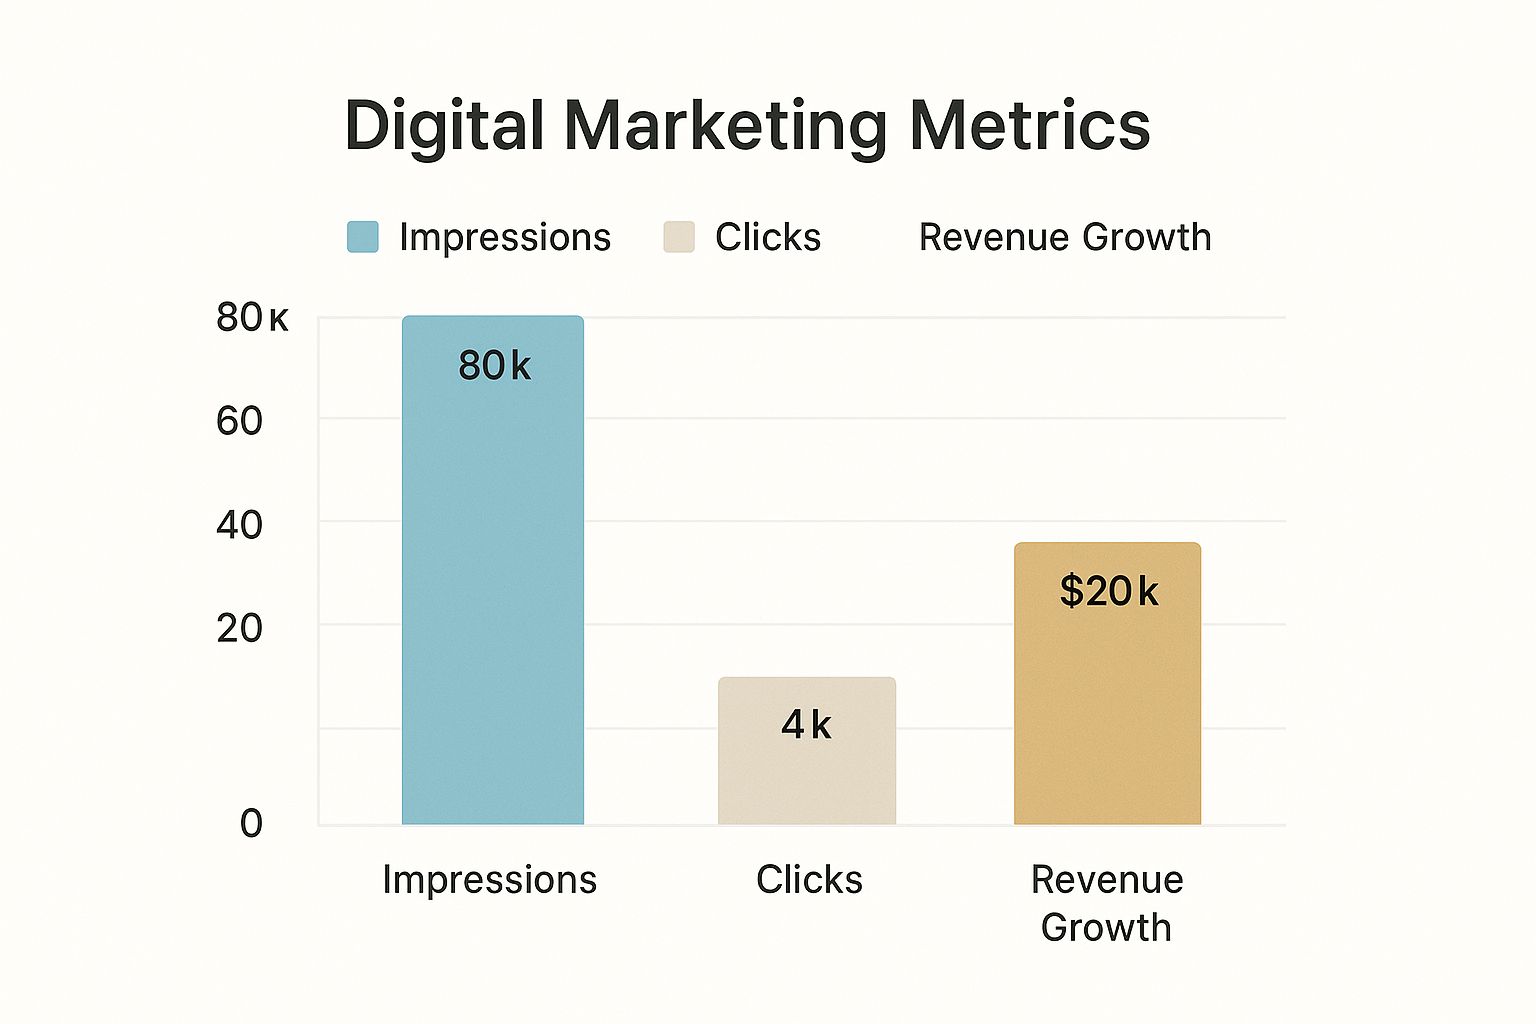
It’s crystal clear: while impressions might look impressive, the only thing that truly matters is the revenue growth generated from a much smaller number of actual clicks.
Key Takeaway: Your framework has to prioritize metrics that reflect business impact over those that just measure activity. Impressions are an activity; revenue is an impact. Always choose to measure impact.
To help you get started, here's a quick cheat sheet for matching common campaign goals with the right KPIs.
| Campaign Goal | Primary KPIs | Secondary KPIs |
|---|---|---|
| Brand Awareness | Impressions, Reach, Social Mentions | Website Traffic, Social Engagement Rate |
| Lead Generation | Cost Per Lead (CPL), MQLs, Conversion Rate | Click-Through Rate (CTR), Landing Page Views |
| Sales Growth | Revenue, Return on Ad Spend (ROAS), AOV | Cart Abandonment Rate, Customer Lifetime Value |
| Customer Engagement | Social Shares, Comments, Time on Page | Email Open Rate, Repeat Visitor Rate |
Choosing the right KPIs isn't just about tracking numbers; it's about focusing your team on what will actually drive the business forward.
This disciplined approach forces you to justify every marketing dollar with a clear line back to business results. If you want to go deeper on connecting data points to strategic decisions, it's worth exploring the science behind data analytics to see how it can sharpen your framework even more. This structure gives you the clarity to optimize campaigns in real-time and confidently report on marketing’s true value.

You've got a framework. Now it's time to zero in on the numbers that actually matter to the health of your campaign and, more importantly, your business. It's incredibly easy to get lost in a sea of data, but a handful of core metrics truly tell the story of your financial impact.
These aren't just numbers you pull for a weekly report; they are diagnostic tools. They tell you what’s working, what's broken, and where your biggest opportunities are hiding. Getting these right is how you learn to speak the language of the C-suite.
Before you can think about high-level financial impact, you have to get a handle on foundational metrics. These are the numbers that track how your audience is engaging and acting. They are the early warning signs—the first clues that tell you whether your campaign is hitting the mark or falling flat.
This is where you focus on things like Conversion Rate (CR) and Click-Through Rate (CTR).
A low CTR is a clear signal that your creative or messaging just isn't compelling enough. On the flip side, a high CTR paired with a dismal CR is a classic sign of a disconnect—your ad makes a promise that the landing page fails to deliver on.
While CR and CTR are vital, they don't get the finance team excited. They don't speak the language of profit and loss. To prove your campaign is financially sound, you must level up to metrics that tie your spending directly to revenue.
This is where Return on Ad Spend (ROAS) and Customer Acquisition Cost (CAC) steal the show.
These two metrics give you a powerful, immediate snapshot of how efficiently your campaign is running. ROAS tells you if your ads are actually making money, and CAC shows you how much you're paying to grow. Seeing a high ROAS on a social media campaign, for example, gives you a rock-solid reason to ask for more budget. If you're looking for ways to boost this, our guide on how to improve social ROI has some great, actionable strategies.
The C-Suite Litmus Test: When you walk into a meeting to present campaign results, lead with ROAS and CAC. These numbers immediately frame the discussion around business impact (revenue and efficiency) instead of marketing activity (clicks and impressions). They answer the one question every executive really cares about: "Was this a good investment?"
ROAS and CAC are fantastic for evaluating short-term wins, but they don't tell the whole story. Many campaigns with a great ROAS only attract one-time buyers who never come back, creating an unsustainable "leaky bucket" model.
This is why the sharpest marketers are laser-focused on the Customer Lifetime Value (LTV) to CAC ratio.
LTV is the total revenue you can expect to get from a single customer over the entire course of their relationship with your brand. The LTV:CAC ratio pits that value against what you spent to get them in the first place. This ratio is the ultimate indicator of your marketing's long-term health and your business's ability to scale.
Here’s a quick breakdown of what the ratio means:
Focusing on the LTV:CAC ratio completely changes the conversation. You stop chasing one-off campaign wins and start thinking about building a truly profitable business. It forces you to consider not just the initial sale, but the entire customer journey and the quality of the customers you’re bringing in. This is how you prove marketing isn't just an expense—it's an investment in the company's future.
Having the right data is one thing, but it’s completely useless without the right tools to make sense of it all. This is where your marketing tech stack comes in. Building a smart one is the only way to turn raw numbers into a clear, unified picture of what’s actually working.
The real goal here is to create a single source of truth. When you do that, you get rid of the data silos that so often lead to terrible decisions and wasted ad spend. Think of your tech stack as the central nervous system of your entire measurement strategy. Get it right, and you can connect every touchpoint—from the first ad impression to the final sale—and see exactly where credit is due.
For almost any e-commerce business, the journey starts with a solid web analytics platform. There's a reason Google Analytics 4 (GA4) is the industry standard. It moved past the old session-based tracking and adopted an event-based model, which is infinitely better for mapping the messy, multi-device journeys of today's shoppers.
Just installing GA4 isn't enough, though. A proper setup is non-negotiable. This means you have to go beyond the default settings and configure the specific conversion events that actually matter to your business. If you're on Shopify, for example, you absolutely need to be tracking key actions like add_to_cart, begin_checkout, and of course, the big one: purchase.
This is the kind of view you get from a standard GA4 dashboard, showing you exactly where your users are coming from.
A quick glance here tells you that "Direct" traffic and "Organic Search" are your top performers. Right away, you know where to focus your energy to get the biggest bang for your buck.
Analytics tells you what happens on your site, but a Customer Relationship Management (CRM) platform tells you who it’s happening to. For any brand with a considered purchase or a longer sales cycle, a CRM like HubSpot or Salesforce is absolutely essential for connecting your marketing efforts to actual revenue.
When you integrate your marketing platforms with a CRM, you get a full picture. You can track a lead from their very first click on a Facebook ad all the way through their journey to becoming a high-value, repeat customer. This kind of closed-loop reporting is how you finally calculate metrics like Customer Lifetime Value (LTV) accurately and prove which campaigns are bringing in the most profitable customers—not just the most clicks.
Single Source of Truth: A well-integrated tech stack stops data discrepancies in their tracks. When your Shopify, Klaviyo, and Google Analytics data all feed into one central dashboard, you put an end to the "he said, she said" arguments between different reports. You can finally make decisions with total confidence.
Once you have the fundamentals locked down, specialized tools can give you a much deeper understanding of specific channels. For instance, trying to measure your social media performance without a dedicated platform is like trying to navigate a new city without a map. Tools like Sprout Social or Hootsuite provide advanced analytics that blow the native insights from social networks out of the water.
In the same vein, you can't optimize what you don't test. A/B testing tools like Optimizely or VWO let you run controlled experiments on everything from ad copy to landing page layouts. This data-driven approach takes the guesswork out of the equation, allowing you to make small, incremental improvements that add up to massive gains in your conversion rates over time.
Picking the right combination of platforms is key, and it helps to look at guides on the best marketing automation tools to see what aligns with your specific needs. Ultimately, your tech stack should work for you, automating the tedious parts of data collection so you can focus on what really matters—making smarter decisions that actually grow the business.
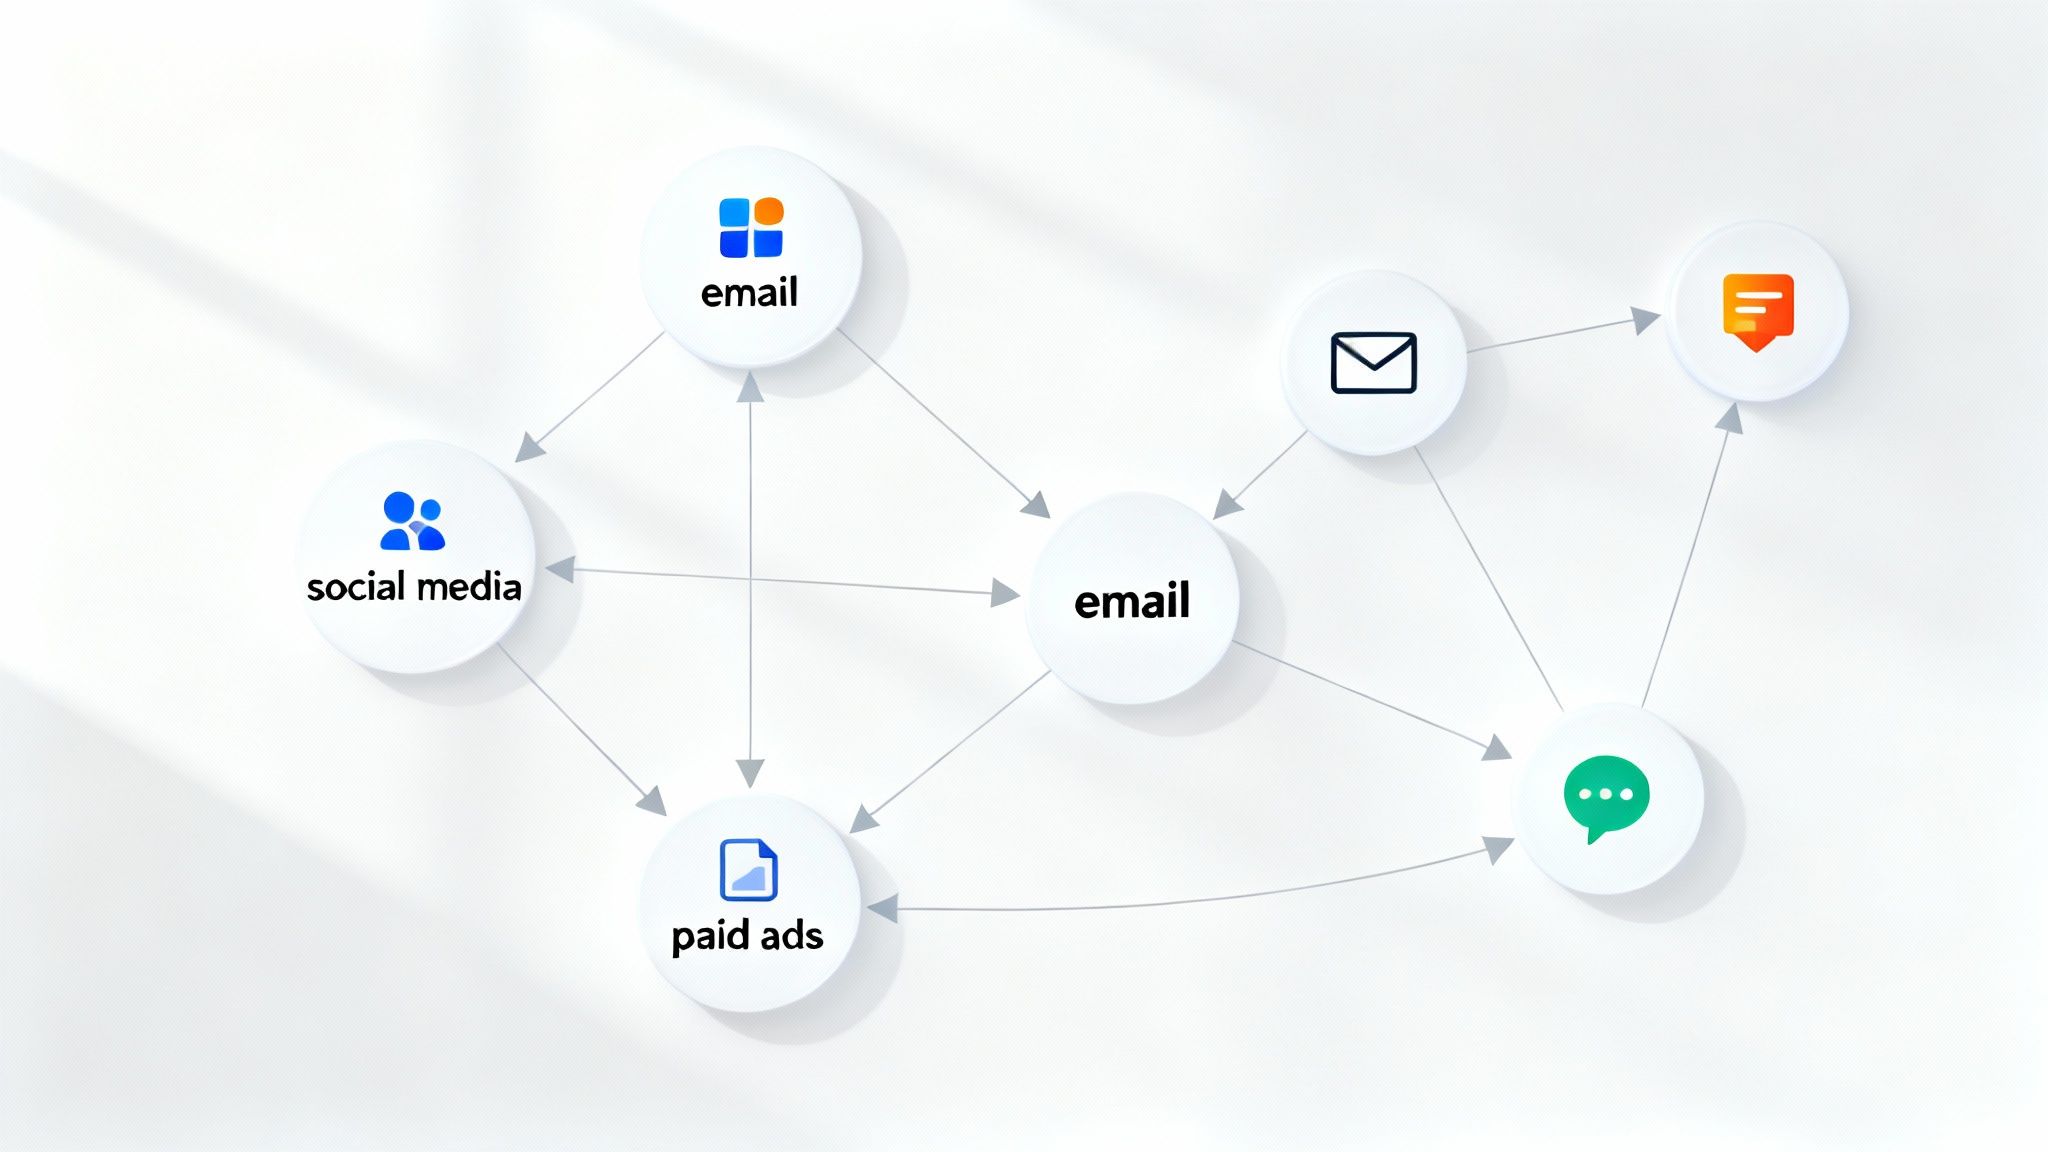
Here's the million-dollar question every marketer faces: how do you prove your campaign actually caused a sale, not just happened to be running when someone decided to buy? This is the complex, messy, but absolutely critical world of attribution—the science of assigning credit to the marketing touchpoints that guided a customer to your checkout page.
Getting attribution right is how you graduate from simply reporting numbers to having strategic, high-stakes conversations about where the next budget dollar should go. Without it, you’re flying blind.
For years, Last-Click Attribution was the industry default. It’s simple enough: whatever ad a customer clicked immediately before buying gets 100% of the credit.
But this model is profoundly broken. It’s like giving all the credit for a Super Bowl win to the player who scored the final touchdown, completely ignoring the quarterback’s pass, the offensive line’s blocking, and the months of coaching that made it all possible.
Think about a real customer journey. Someone might see a TikTok ad, get hit with a retargeting ad on Instagram, read a blog post they found on Google, and then finally click a branded search ad to make a purchase. The last-click model pretends those first three touchpoints never happened, leading you to dangerously undervalue the very channels that build awareness and trust.
To get a clearer picture, smart marketers are moving to multi-touch models that distribute credit more thoughtfully across the entire customer path.
So which model is right? It depends entirely on your business. A brand selling a low-cost, impulse-buy item might find Time-Decay works perfectly, while a B2B company with a six-month sales cycle will likely get more accurate insights from a Position-Based approach.
The Attribution Trap: No single attribution model is perfect. The real goal isn't to find one flawless formula, but to use a combination of data and human judgment to understand how your channels work together. That understanding is what truly drives better budget decisions.
While multi-touch models are a massive leap forward, the most sophisticated marketers are pushing even further to measure true causality. They’re asking the ultimate question: "What would have happened if we hadn't run this campaign at all?"
Two powerful techniques help get to that answer:
Once you start mastering these concepts, you can finally shift the conversation away from vanity metrics. You'll be able to prove the direct, causal link between your marketing spend and real revenue growth. That's a conversation every C-suite wants to have.
Wrestling with marketing measurement can feel like trying to nail Jell-O to a wall. It brings up a ton of questions. Where do you even start on a shoestring budget? How often should you actually be pulling reports? The practical challenges can get in the way of real clarity.
Here are some of the most common questions from marketers, with straightforward answers to help you get a real handle on your campaign effectiveness.
A small budget doesn’t mean you can’t make a big impact; it just means you have to be surgical with your measurement. Forget about tracking dozens of vanity metrics. Your focus needs to be razor-sharp, aimed squarely at the actions that generate revenue.
The whole game is about proving that every single dollar you spend is bringing back more. That’s how you build the case to get a bigger budget next quarter.
Start by zeroing in on your single most important conversion. For a Shopify store, that’s almost always a sale.
When you’re working with a small budget, there's no room for waste. Be ruthless about cutting channels that don't perform based on these core financial metrics. That’s your key to winning.
There's no magic number here. The right reporting cadence comes down to two things: who you're reporting to and how long your campaign is running.
Here’s a simple framework: match the frequency of the report to the speed at which you can make a meaningful decision based on the data.
For your internal marketing team, you need a tight feedback loop to optimize on the fly.
Actionable Advice: Don't fall into the trap of "reporting for the sake of reporting." Every report should exist to answer a question or inform a decision. If it doesn't lead to a clear action, you're probably pulling it too often.
This is one of the most common points of confusion out there. Getting this right is critical to understanding if your marketing is actually profitable. While they both measure your return, they’re looking at it from completely different altitudes.
Return on Ad Spend (ROAS) is a narrow, campaign-specific metric. You calculate it by dividing the revenue from an ad campaign by the cost of that ad campaign. It answers a simple question: "For every dollar I spent on these Facebook ads, how many dollars in sales came back?"
Return on Investment (ROI) is the big-picture business metric. It looks at the total profit generated from an investment compared to its total cost. For marketing, that doesn’t just mean ad spend. It includes everything—the cost of your marketing software, your team's salaries, fees for creative work. It answers the much bigger question: "After paying for everything, was this entire marketing push actually profitable for the business?"
Think of it this way: a campaign might have a fantastic 4:1 ROAS, which looks great on paper. But if your product margins are thin and the cost of your team's time wipes out that gain, the overall ROI could easily be negative.
For a long time, measuring influencer marketing felt more like guesswork than science. Thankfully, the industry has matured. While likes and shares are nice, the conversation must shift toward real business results.
A recent global survey showed that while 79% of marketers still look at engagement, nearly half are now rightly focused on direct product sales to prove success. You can see more on these influencer marketing metrics.
To get a real sense of an influencer’s impact, you need to use a blended approach.
By combining direct attribution with a broader look at brand impact, you can finally move past vanity metrics and see an influencer’s true value.
Ready to turn campaign urgency into predictable revenue growth? Quikly moves beyond basic timers by using proven behavioral science to create high-impact marketing moments that drive immediate action. See how brands on Shopify Plus are boosting LTV and protecting profit margins. Explore the power of Quikly.

