
ecommerce psychology
brand loyalty
best brand experiences
Your inventory turnover rate is one of the most powerful vital signs for your ecommerce business. It answers a simple but critical question: How fast are you turning stock into cash? This isn't just a number for your accountant; it's a direct measure of your operational efficiency and a key indicator of product-market fit. A low turnover rate doesn't just hurt—it quietly drains profit by inflating holding costs and tying up capital that could be used for growth.
A high turnover rate is generally a strong signal of health. It means products are moving efficiently from your warehouse to your customers, which improves cash flow and maximizes the return on your inventory investment. On the other hand, a low turnover rate can be a major red flag. It often points to problems like overstocking, fading demand, or pricing misalignment. When inventory sits, it's not just taking up space—it's actively costing you money and eroding your profit margins.
Every single product you stock has costs that go way beyond its purchase price. Think about storage fees, insurance, and the risk of the product becoming obsolete or damaged. These are called holding costs, and they are a direct threat to your profitability.
For some businesses, these expenses can eat up a shocking 20-30% of your inventory's value every year. (You can find some great insights on this over at Netstock.com). A healthy turnover rate puts a stop to that bleeding, directly protecting your profit margins and boosting your ROI.
Plus, faster turnover means better cash flow. When you convert inventory into revenue quickly, you have the cash on hand to pay suppliers, invest in marketing, or pivot when the market shifts. That financial agility is what separates businesses that thrive from those that just survive.
Tracking inventory turnover isn’t an isolated task. When analyzed alongside other key metrics, you get a full picture of your business's health. You start managing your inventory as the asset it is, not just as stuff you sell.
Ultimately, getting a handle on your inventory turnover rate empowers you to make smarter, more profitable decisions across the board. It helps you pinpoint:
Think of your inventory turnover calculation as a diagnostic tool. By running it regularly, you’re making sure your business stays lean, profitable, and ready to scale. For a deeper dive, check out our guide on the most important sales performance metrics for your dashboard.
Getting an accurate inventory turnover rate is the bedrock of smart stock management. If you fudge this number, you could be making strategic decisions based on flawed data—masking dead stock that's draining your cash flow or giving you a false sense of security. The good news is, the calculation itself is straightforward. It all comes down to two numbers you're probably already tracking: Cost of Goods Sold (COGS) and Average Inventory.
This flow chart breaks it down to its simplest form.
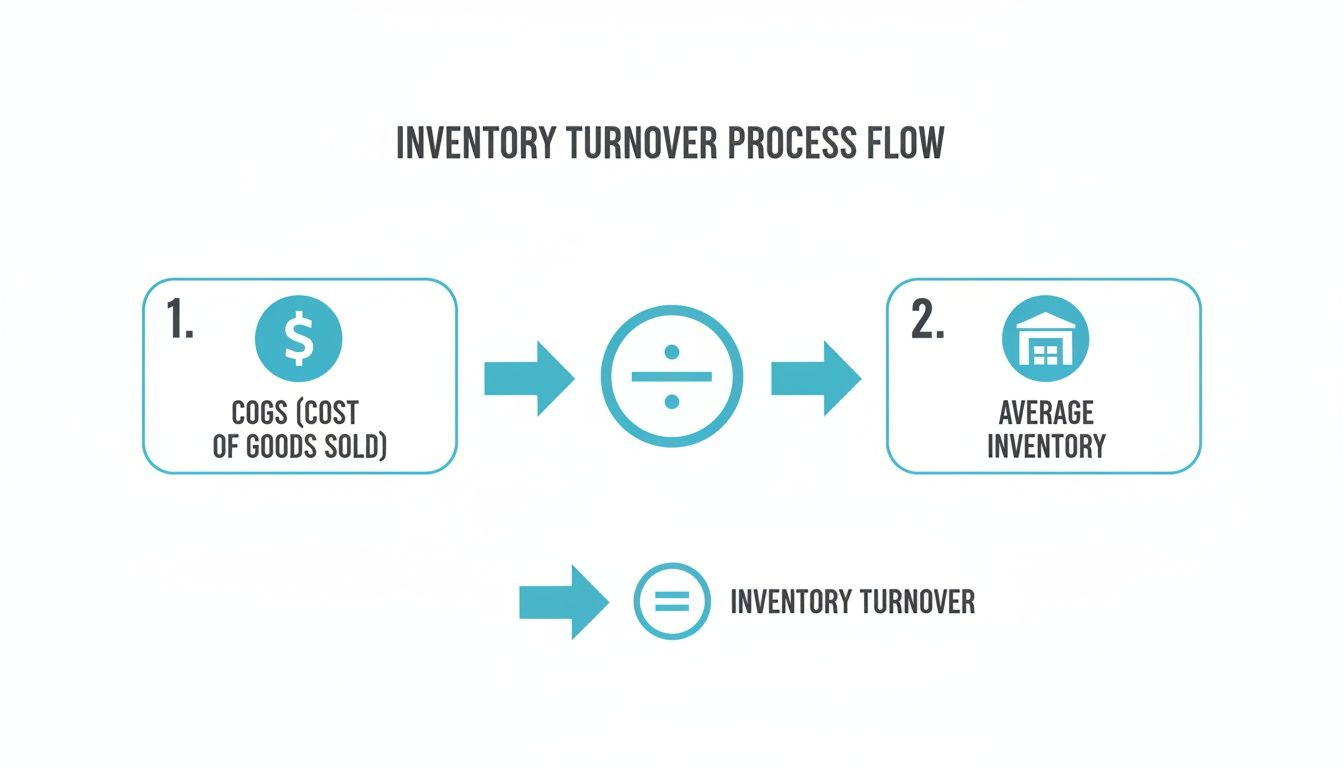
As you can see, you’re just dividing the total cost of the products you sold by the average value of the inventory you had on hand during that same time.
Your Cost of Goods Sold (COGS) is simply what it cost you to produce the items you sold. Think materials, direct labor—anything that went directly into creating the product. This number doesn't include indirect costs like marketing spend or your sales team's salaries.
To get your COGS for a specific period, like a quarter or a full year, the formula is simple:
COGS = Beginning Inventory + Purchases During Period - Ending Inventory
Let's walk through an example. Imagine you run a growing apparel brand on Shopify.
On January 1st, you started the year with $50,000 worth of inventory. Over the next 12 months, you bought another $200,000 in new stock from your suppliers. When you did your final count on December 31st, you had $30,000 in inventory left.
Plug those numbers in: $50,000 + $200,000 - $30,000 = $220,000 in COGS for the year.
Now you need to figure out your Average Inventory for that same period. Why the average? Because just using your beginning or ending inventory value can be really misleading. It won't account for big swings from seasonal rushes or large POs. The average gives you a much more stable, realistic picture of your typical inventory levels.
Here's the formula:
Average Inventory = (Beginning Inventory + Ending Inventory) / 2
Let's stick with our apparel brand example:
The calculation is: ($50,000 + $30,000) / 2 = $40,000 in Average Inventory.
Pro Tip: Always, always use COGS instead of revenue for this calculation. Revenue includes your profit margin, which will seriously inflate your turnover rate and hide how efficiently you're actually managing your stock.
It's also worth noting that different inventory valuation techniques, like FIFO or LIFO, can change your final COGS value. The most important thing is to be consistent with the method you choose.
Okay, you've got both pieces of the puzzle. Now you can get your final inventory turnover rate.
Inventory Turnover Rate = COGS / Average Inventory
For our Shopify apparel brand, the math looks like this: $220,000 / $40,000 = 5.5
What does that mean? It means the brand sold through and replaced its entire inventory 5.5 times over the course of the year. This number is your new best friend—it's the baseline you'll use to track, analyze, and improve your operations.
If you're on Shopify, you can usually pull these numbers from your analytics and reports. Look under the "Inventory" or "Sales" sections. Many of the top apps for Shopify stores can also help you pull these reports in just a few clicks.
You’ve run the calculation, and now you have a number. Great. But that number is pretty useless without some context. A turnover rate of 4 might be a sign of incredible efficiency for one business and a five-alarm fire for another.
Why? Because a "good" turnover rate is entirely dependent on your industry.
Think about it. Comparing a fast-fashion brand to a luxury furniture store is like comparing apples to oranges. The fashion store expects to turn its entire collection multiple times a season. Meanwhile, the furniture retailer is dealing with high-cost, slow-moving statement pieces. One isn’t necessarily better than the other; they just operate on completely different models.

To figure out if your rate is healthy, you need to see how it stacks up against industry benchmarks. These averages give you a realistic yardstick to measure your own performance. For most retail businesses, a typical rate falls somewhere between 5 and 10, which means they sell and replace their inventory every one to two months.
But the variations can be dramatic. Supermarkets have incredibly high turnover rates—sometimes topping 15—because their products are perishable. On the flip side, a high-end jewelry store might only turn its inventory once or twice a year. That’s perfectly normal given the high value and infrequent purchase cycle of its products.
A common mistake is chasing the highest possible turnover rate without thinking about the side effects. An excessively high rate can actually signal you're under-stocking. That leads to stockouts and lost sales, which directly damages customer trust and your bottom line.
The data shows just how wide the gap can be. General retail averages around a 12.46 turnover rate, while slower-moving industries like utilities lag at 9.76. The key takeaway here is that operational models and consumer demand shape what’s considered "good." In fact, businesses that keep their turnover rate above 8 often see 5-10% higher profit margins, proving the direct link between efficiency and profitability. You can dive deeper into these numbers with industry turnover rates at csimarket.com.
To make this a bit more concrete, here are some common e-commerce categories:
To give you an even clearer picture, here’s a quick look at how different sectors compare.
Use this table to compare your turnover rate against industry benchmarks and understand the strategic implications for your inventory management.
| Industry Sector | Average Annual Turnover Rate | Strategic Implication |
|---|---|---|
| Supermarkets & Grocery | 15 - 20 | High volume, low margins; requires precise, frequent reordering. |
| Fast Fashion | 10 - 15 | Rapid trend cycles demand aggressive stock clearance and lean inventory. |
| General Retail | 8 - 12 | Balanced approach to stock depth and breadth to meet steady demand. |
| Apparel & Accessories | 4 - 6 | Focus on seasonal planning and managing markdowns effectively. |
| Consumer Electronics | 8 - 15 | Must manage product lifecycle to avoid obsolescence of old tech. |
| Home Goods & Furniture | 3 - 4 | High carrying costs; often relies on a just-in-time or dropship model. |
| Luxury Goods | 1 - 2 | Exclusivity and high value dictate a slow-moving, low-volume strategy. |
Remember, the goal isn't just to match an industry average but to understand where you stand and why. Your inventory turnover rate calculation gives you the "what." The industry context provides the "so what," turning a simple metric into a powerful tool for strategic planning.
Getting your inventory turnover rate right is the bedrock of a smart inventory strategy. But a few common, seemingly small mistakes can completely throw off your numbers, leading you down a path of bad decisions on purchasing, marketing, and cash flow.
Let's make sure your data is a reliable asset, not a liability.
This is probably the most frequent error. It’s tempting to just plug in your total sales revenue, but doing so will dramatically inflate your turnover ratio. Why? Because revenue includes your profit margin, making it seem like you're flying through inventory way faster than you actually are.
It’s a dangerous mistake because it masks real problems. It can hide those slow-moving SKUs that are tying up cash and make your overall operation look far more efficient than it is, delaying critical calls on pricing or promotions.
Another classic trip-up is using a single point-in-time inventory value—usually the ending number—instead of the average. Your stock levels are constantly in flux. They spike when a big supplier order lands and dip during a major sale. Using just one number, like your end-of-year figure, doesn't capture that reality.
Imagine a Shopify store that stocks up heavily for Black Friday. If you only look at the inventory value on December 31st after the holiday dust has settled, your stock will look artificially low. This skews the whole calculation, giving you a misleadingly high turnover rate that doesn't reflect how your business actually operated for the entire year.
Actionable Takeaway: Always use the formula (Beginning Inventory + Ending Inventory) / 2 to find your average inventory. If your business has major seasonal swings, get even more precise by calculating a quarterly average.
This one sounds obvious, but it happens. For your turnover rate to mean anything, the time periods for your COGS and your average inventory have to match up perfectly. You can't compare a full year's worth of COGS against an average inventory calculated from just a single quarter.
It’s like comparing apples and oranges; the data points don't align, and any conclusion you draw from them will be fundamentally flawed.
Nailing this consistency is a simple but completely non-negotiable step. By sidestepping these common blunders, you can be confident that your inventory turnover rate is a true pulse check on your business's health, empowering you to make strategic decisions that actually move the needle.
Okay, so you've calculated your inventory turnover rate. That number is more than just a data point; it's a diagnosis of your business's health. If that number feels a little sluggish, it’s a clear signal to start making some strategic moves to boost efficiency and protect your bottom line.

Improving your turnover isn’t about throwing things at the wall to see what sticks. It's about a focused effort on smarter forecasting, strategic pricing, and creating genuine, undeniable demand.
Overstocking is the enemy of a healthy turnover rate, and accurate demand forecasting is your best weapon against it. It's time to move past gut feelings and let your data do the talking.
Price is one of the most powerful levers you can pull to influence how fast your products move. If your prices are set in stone, you're leaving cash on the table and inventory on the shelves.
Think about using dynamic pricing for products that are nearing the end of their season. Small, well-timed markdowns can get things moving and free up capital much more effectively than a massive, margin-destroying clearance sale down the road. Another great move? Bundle a slow-moving item with a bestseller to boost its perceived value and get it out the door.
Sometimes, slow inventory isn't a product problem—it's a motivation problem. This is where the psychology of urgency and scarcity can work wonders, pushing customers to buy now without you having to slash prices.
This strategy taps directly into loss aversion, a core concept in behavioral economics. The fear of missing out (FOMO) on a limited-time offer or a nearly sold-out product is a much stronger motivator than the prospect of a simple gain.
Instead of a generic "Sale!" banner that can cheapen your brand, you can build campaigns that create a compelling reason to act immediately. Basic countdown timers only scratch the surface. The next generation of urgency marketing, pioneered by Quikly, leverages sophisticated behavioral triggers. Quikly's "Moments" marketing creates high-energy, automated events that drive a burst of sales, clearing out specific inventory while protecting your margins because the excitement comes from the experience, not just the discount. This is the difference between simple manipulation and sophisticated marketing psychology.
And for those popular items that do sell out? You can turn that demand into your next win. Check out our guide on creating powerful back-in-stock notifications to see how.
This push for efficiency is something we're seeing across the board. In major US markets, the inventories-to-sales ratio—a metric that’s a close cousin to turnover—recently tightened from 1.40 to 1.37. It shows businesses are getting better at matching stock to sales, which is critical when you realize holding costs can eat up 10-20% of your profitability. You can dive deeper into these manufacturing and trade inventories statistics to get the bigger economic picture.
Getting a handle on the inventory turnover formula is a huge first step. But once you start putting it into practice, the real-world questions pop up. Let's dig into some of the most common ones I hear from store owners so you can use this metric like a pro.
Yes, and honestly, you'd be missing a trick if you didn't. Calculating turnover for individual SKUs is one of the most powerful ways to spot your heroes and your zeros.
The math is exactly the same, you just plug in the Cost of Goods Sold and average inventory value for that specific item. This micro-level view is what lets you make genuinely smart decisions—like confidently reordering your bestsellers, running a flash sale on a slow-mover, or finally cutting ties with a product that's just collecting dust and draining cash.
The honest answer? It depends entirely on how fast your world moves.
The most important thing is to be consistent. Pick a schedule that makes sense for your business and stick to it. That's the only way you can track your performance over time and see if your strategies are actually working.
It might sound strange, but yes. While a high turnover rate usually gets a gold star, an extremely high rate can be a symptom of a different problem: under-stocking.
If you're turning over inventory at lightning speed, it could mean you're constantly on the verge of selling out. This leads to stockouts, which are a direct path to frustrated customers and, worse, lost sales that you can never get back. This is particularly damaging when considering the average ecommerce cart abandonment rate hovers around 70%; you can't afford to lose the customers who actually intend to buy. The goal isn't just to get the highest number possible. It's about finding that sweet spot where you maximize sales and keep shoppers happy without tying up too much cash in stock or missing out on potential revenue.
Ready to turn slow-moving inventory into immediate revenue? Quikly uses the science of urgency marketing to create high-energy sales events that move stock and protect your margins. Discover how to improve your turnover rate.

